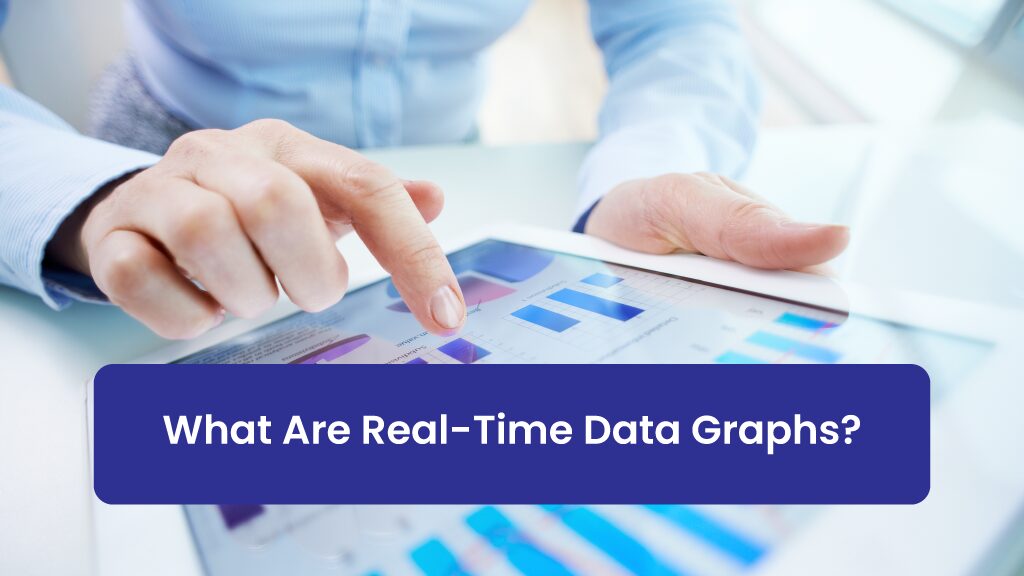
In today’s fast-paced digital landscape, real-time insights have become the cornerstone of personalized customer experiences and data-driven decision-making. Imagine walking into a store where the staff instantly knows your preferences, recommends products, and addresses your needs in the moment. Now, scale this to a digital ecosystem—that’s the promise of Real-Time Data Graphs in Data Cloud.
Real-time data graphs revolutionize how businesses visualize, process, and act on their data. By weaving together complex data models into an accessible structure, they empower organizations to make split-second decisions that delight customers and drive outcomes.
Understanding Real-Time Data Graphs
At its core, a real-time data graph is a denormalized, pre-computed visualization of relationships between various Data Model Objects (DMOs). These graphs allow businesses to:
- Access key customer data in milliseconds, enabling faster responses and more dynamic customer interactions.
- Enable faster identity resolution and segmentation to create personalized experiences tailored to each customer.
- Perform actions on ingested data to ensure it’s ready for downstream applications like AI-driven agents or dynamic personalization engines, boosting operational efficiency.
The Business Challenge
Picture a customer interacting with your website. They’ve browsed anonymously for weeks but finally created an account. Now, your systems need to:
- Stitch their anonymous activity to their known profile, connecting past and present behaviors for a seamless experience.
- Incorporate data from other sources to build a holistic Customer 360 view, ensuring no critical insight is missed.
- Do this seamlessly, in milliseconds, while the customer is still engaged, preventing potential drop-offs due to delays.
Traditional data models, being highly normalized, struggle with such real-time workloads due to high latency. Real-time data graphs address this limitation by optimizing data retrieval processes for speed and accuracy.
How Real-Time Data Graphs Work
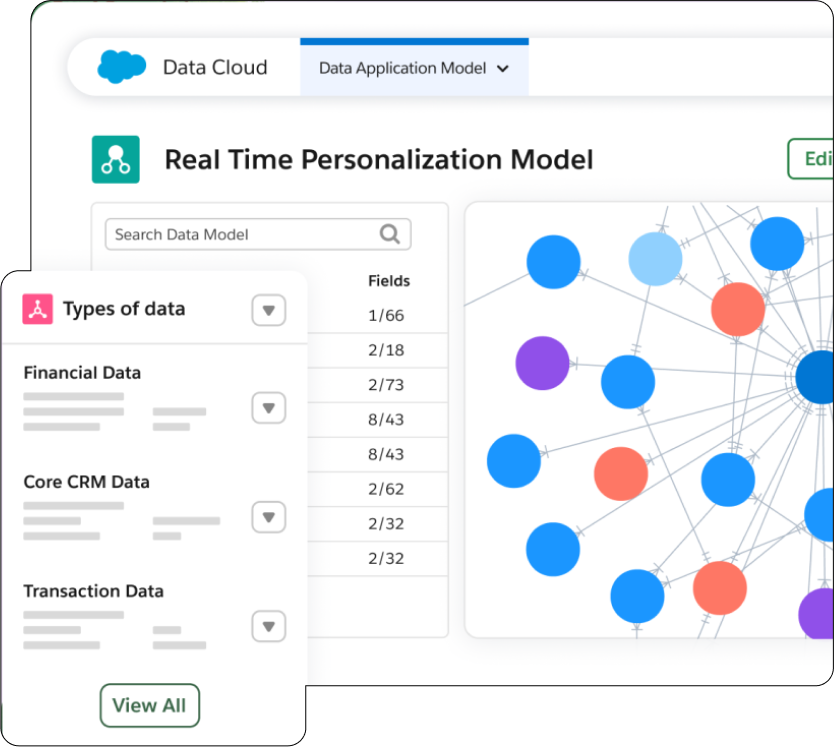 Real-time data graphs function by creating a denormalized, queryable graph of interconnected data. Here’s how they operate:
- Pre-Computed Relationships: They map and store relationships between DMOs, customer interactions, and segments ahead of time, reducing computational load during queries.
- Query APIs: Using Query APIs, businesses can retrieve data in milliseconds, enabling real-time actions like dynamic content delivery or instant recommendations.
- Dynamic Updates: As data is ingested via Web SDKs or Mobile SDKs, the graph updates instantaneously, ensuring that the most current information is always available for decision-making.
This architecture ensures businesses can act on insights immediately, keeping up with customer demands in real time.
Use Cases of Real-Time Data Graphs
1. Customer 360 View
Consolidate customer data from multiple channels, such as website activity, purchase history, and social interactions, to create a unified, actionable profile that drives personalized experiences.
2. Next-Page Personalization
Process data in real time to serve personalized content, such as product recommendations or targeted offers, while the customer is still browsing your website.
3. Cross-Cloud Integrations
Leverage data graphs in data cloud to integrate insights across platforms like Salesforce Sales Cloud, Marketing Cloud, and Service Cloud, ensuring a consistent and seamless customer experience across touchpoints.
4. Predictive Analytics
Use real-time insights to predict customer behavior, optimize marketing efforts, and recommend products or services based on historical and live data.
Benefits of Real-Time Data Graphs
1. Improved Decision-Making
By unifying disparate data sources into a single, actionable graph, real-time data graphs enable precise and timely decisions that align with business goals and customer expectations.
2. Enhanced Customer Experience
Deliver hyper-personalized interactions with real-time insights, ensuring that every touchpoint feels tailored and relevant to the customer’s needs.
3. Operational Efficiency
Reduce latency and improve data retrieval speeds, enabling faster workflows and minimizing downtime for critical business processes.
4. Data-Driven Innovation
Visualizing complex data relationships opens up new opportunities for innovation, such as uncovering hidden trends, identifying growth opportunities, and developing cutting-edge solutions.
How Salesforce Data Graph APIs Bring It All Together
Salesforce’s Data Graph APIs offer robust capabilities to leverage real-time data graphs, allowing businesses to:
- Access up-to-the-minute insights into customer behavior, providing a real-time view of interactions and preferences.
- Process real-time identity resolution and segmentation, ensuring customer profiles are accurate and actionable at every moment.
- Return data graph records in milliseconds via REST APIs, enabling seamless integration with existing systems and delivering immediate results.
These features make it possible to integrate real-time data graphs seamlessly into your existing tech stack, driving efficiency, innovation, and customer satisfaction.
Wrapping Up:
Real-time data graphs in data cloud are not just a technological advancement—they’re a strategic enabler for businesses striving to stay ahead in a hyper-competitive world. By bridging the gap between data and action, they empower organizations to deliver experiences that customers not only expect but remember. These graphs provide the speed, efficiency, and accuracy needed to turn data into impactful decisions in real time.
Ready to transform your data into actionable insights? Contact us today to explore the power of real-time data graphs with CEPTES!
FAQ:
1. What is a real-time data graph?
2. How does a real-time data graph differ from traditional data models?
3. What are common use cases for real-time data graphs?
Customer 360 views, next-page personalization, predictive analytics, and cross-cloud integrations are just a few of the many applications of real-time data graphs.
4. What role do Salesforce Data Graph APIs play?
5. Why are real-time data graphs critical for businesses?

Nilamani Das
Nilamani is a thought leader who champions the integration of AI, Data, CRM and Trust to craft impactful marketing strategies. He carries 25+ years of expertise in the technology industry with expertise in Go-to-Market Strategy, Marketing, Digital Transformation, Vision Development and Business Innovation.


