Salesforce has expanded 221.3 times since 2004, and as per 2024 figures, it currently provides services to over 150,000 enterprises worldwide. Its total annual revenue stands at $34.86 billion. We might thus estimate that businesses spend millions of dollars annually on Salesforce services. Sales and service enablement, process, top talent acquisition, and material and technology optimization are a few of these offerings. All this money, however, is useless if businesses don’t properly track and assess how Salesforce org services affect overall organizational effectiveness.
If you keep an eye on your Salesforce org, you’ll be able to notice Salesforce performance issues, report those to Salesforce or your team, and get help faster. A strong monitoring solution is essential when Apex classes fail, Case generation errors plague your Service Team, or Opportunities can’t be “closed” because of unmanaged exceptions.
As a result, to stay competitive, many firms rely on Salesforce CRM to retain workflow visibility, enhance processes, employ the most recent tools and innovations, allow sales and services, and other functions.
Salesforce helps organizations manage large amounts of data, procedures, and various pages, yet this may influence the performance and load time of the Salesforce Org, raising customer complaints and complicating business processes. Hence, measuring and improving Salesforce Org Performance is critical while working on Salesforce CRM.
Measuring Organizational Performance for Salesforce
Performance and scalability should be considered two factors in measuring strategies for your organizational salesforce org. Performance in Salesforce is defined as a system’s speed and effectiveness under a specific workload over a specified period. The ability of a system to meet response time or throughput targets as application and system processing requirements grow is known as scalability. Make your implementation performance and scalable.
Now, establish your test org and test client before doing an accurate performance evaluation per the following steps:
Create Key Personas and a Plan for Your Performance Evaluation
This step entails creating a precise sandbox organization and using key personas while making your test.
Steps before we proceed: It is advised to use a sandbox that is an exact replica of your production organization. Make sure your sandbox’s database structure corresponds to the one in production.
Create a system diagram to represent future and current Salesforce features, processes, and users. Calculate the peak and average loads as well as the feature usage for each system component. Think about user arrival rates, logon rates, session lengths, and page views. If available, any existing site statistics as a starting point.
Find the throughput of your system in requests per second (RPS). RPS combines incoming API calls and XML HTTP Requests (XHRs), both of which are supported by Event Monitoring. Additionally, estimate their size and shape, the number of accounts, feeds, groups, users, and other elements in your data. Furthermore, include any intricate relationships between your things, position hierarchies, and sharing regulations in your sandbox organization.
After building your sandbox organization, identify your key personas and base your Salesforce performance testing on their page flows. Data volumes and visibility vary between identities. A persona with a comprehensive perspective of the data in your business, like the VP of Sales, may behave differently than users in more specialized roles. Based on your primary personas, create a site map, and identify potential page flows for each character.
Next step – running some performance tests!
Create and Carry Out Performance Tests
Create tests to evaluate the stress on your data, networks, and essential personalities.
Steps before we proceed: Before analyzing your company’s performance, test your browser’s octane rating and network latency utilizing the same hardware and network conditions as your customers. Address any Salesforce performance issues before testing your organization.
Define the parameters of your investigation, the elements to be tested, and the metrics you want to evaluate for each test. Conduct your performance test numerous times to eliminate variance. Regularly run your tests and note any variations in throughput and response times. Salesforce Performance testing is iterative. Your testing may uncover problems that need to be found and fixed as well as new ones.
Salesforce tracks performance in terms of Experienced Page Time (EPT). EPT may be measured in four ways.
Insert an EPT counter into your app’s header
Use Lightning Component Debug Mode or append ?eptVisible=1 to your URL to add an EPT counter to your app’s header.
https://MyDomainName.lightning.force.com/one/one.app?eptVisible=1
Lightning Component Debug Mode usually has a negative impact on performance since it does not minify code. However, the performance impact of ?eptVisible=1 is less significant.
Use the Lightning Usage App to see how well a page and the browser are performing
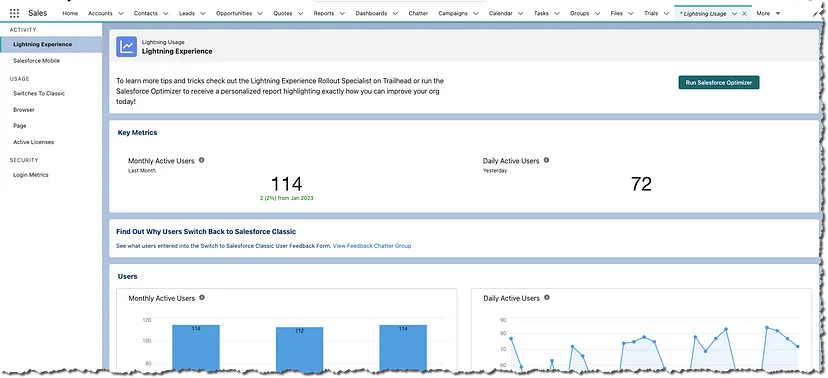
By mixing elements from the Lightning Usage App, you may create a unique report
To measure EPT with dashboards and reports in the Lightning Usage App, create a report type using a Lightning Usage App object. After creating the report type, generate the report employing Report Builder. There are the following Lightning Usage App objects:
- LightningUsageByAppTypeMetrics
- LightningUsageByBrowserMetrics
- LightningUsageByPageMetrics
- LightningUsageByFlexiPageMetrics
To track performance using event types, use the Event Monitoring Analytics App
EPT, also with the Event Monitoring Analytics App could be measured using the Lightning Performance dashboard. Event types can be utilized to monitor certain performance components. Several instances of helpful event types include:
- Apex REST API
- Lightning Page View
- Lightning Error
- Lightning Interaction
- Lightning Performance
Additionally, use automated processes, such as Selenium, to assess page flow performance and browser developer tools, such as EPT, to evaluate network throttling. Make persona-based load-generating algorithms using tools like LoadRunner or JMeter.
To summarize, it is clear how important it is to keep an eye on your business and how many possibilities are offered by pre-built Salesforce elements or premium offerings if your budget permits. A summary dashboard made using Lightning Web Components may also display several of the above mentioned features. So, start implementing these steps as soon as it is practical rather than being reactive to Salesforce performance issues at the last moment.
To learn more about Salesforce Org Performance Measurement, contact us.
FAQs
1. What is Salesforce Org Performance Measurement?
2. How can I measure Experienced Page Time (EPT) in Salesforce?
3. What tools can be used for Salesforce performance testing?
4. Why is monitoring Salesforce Org Performance important?

Nilamani Das
Nilamani is a thought leader who champions the integration of AI, Data, CRM and Trust to craft impactful marketing strategies. He carries 25+ years of expertise in the technology industry with expertise in Go-to-Market Strategy, Marketing, Digital Transformation, Vision Development and Business Innovation.


